Gantt charts for construction: a practical UK guide
Discover how to effectively use Gantt charts for construction schedules. Streamline tasks, set dependencies, and ensure project success on UK building sites.
By James Shorter ·
Gantt charts for construction: a practical UK guide

A construction Gantt chart is a visual schedule that maps every site task as a horizontal bar across a timeline, showing planned start and finish dates, durations, dependencies between trades, and key milestones. It is the most widely used format for communicating a construction programme to subbies, clients, and the site team.
The quickest route to a working chart:
- Break down the work into phases and tasks (your work breakdown structure, or WBS).
- Estimate durations for each task, factoring in curing times, lead times, and weather buffers.
- Set dependencies so the chart knows that first-fix electrics cannot start until the frame is watertight.
- Add milestones for planning conditions, inspections, and handover.
- Upload to a spreadsheet or scheduling tool and issue to subbies with a revision number.
That process takes 20 minutes on a small job and a few hours on a larger one. The chart is only useful if it stays current.
Pro Tip: Baseline the programme before work starts. Save a locked copy of the original planned dates, then track actual progress against it. Even a simple percentage-complete column updated weekly tells you whether you are ahead or behind before a problem becomes a delay.
Key takeaways
A construction Gantt chart is only as useful as the discipline behind it: build it with the right fields, baseline it before work starts, and update it every week with evidence attached.
| Point | Details |
|---|---|
| Build the WBS first | Break the project into phases and tasks before adding dates or durations. |
| Baseline before work starts | Lock the original planned dates as Rev 0 and measure all progress against them. |
| Assign every task an owner | Tasks without a named subcontractor or trade do not get updated. |
| Keep hard constraints minimal | Too many hard constraints distort the critical path and hide genuine programme risk. |
| BRCKS connects schedule to site | BRCKS links programme tasks to site diaries, photos, and variations automatically, at £40/seat/month. |
Table of Contents
- What is a construction Gantt chart, and how does it differ from other project timelines?
- What must every construction Gantt chart include?
- Why use Gantt charts on construction projects?
- How to build a construction Gantt chart: step-by-step
- Worked example: starter Gantt for a small residential new-build
- How to integrate your Gantt with other site tools and workflows
- How do you choose the right Gantt tool for UK builders?
- UK best practice: dynamic time modelling and hybrid scheduling
- Common pitfalls when using Gantt charts on site
- Starter templates and import notes
- An experienced builder’s perspective on keeping programmes live
- BRCKS keeps your construction programme live
- Sources
- FAQ
What is a construction Gantt chart, and how does it differ from other project timelines?
A Gantt chart is a specific type of project schedule, not just a list of dates. A plain timeline or date list tells you when something is supposed to happen. A Gantt chart shows the relationship between tasks, so you can see at a glance what depends on what, where float exists, and which activities sit on the critical path.
For construction, that distinction matters practically. A residential build involves dozens of trades whose windows overlap or must follow strict sequences: groundworkers before concreters, concreters before frame erection, frame before roofing, roofing before first-fix trades can work inside. A date list cannot capture those dependencies. A Gantt chart can.
Oracle’s guidance on construction scheduling techniques notes that Gantt charts are easy to read and widely used for displaying CPM, LPS, PERT and resource-oriented schedules. The same guidance flags that they become harder to interpret as projects grow and demand frequent updates to stay accurate.
Construction-specific elements you will not find on a generic project Gantt:
- Trade-driven sequencing (groundworks, frame, envelope, first fix, second fix, finishes)
- Weather and curing constraints (concrete, render, screed, paint)
- Subcontractor mobilisation windows and notice periods
- Planning permission, milestones, and condition discharge dates
- On-site versus off-site fabrication activities (structural steel, timber frame, joinery)
- Inspection hold points (building control, warranty provider, client sign-off)
These elements make a construction Gantt chart a different tool from a software-development sprint board or a marketing campaign timeline, even when the underlying bar-chart format looks the same.
What must every construction Gantt chart include?
A Gantt chart that is missing key fields becomes unreliable within a week on site. These are the core elements to build in from the start.
- Task name and ID — unique reference so subbies and the site diary can cross-reference without ambiguity.
- Phase — group tasks by phase (substructure, superstructure, envelope, fit-out, finishes) to allow roll-up summary rows.
- Owner — the subcontractor or trade responsible. Without an owner, nobody chases progress.
- Planned start and finish — the baseline dates before any work begins.
- Duration — working days, not calendar days. Note any non-working periods (bank holidays, Christmas shutdown).
- Predecessors and dependencies — finish-to-start is the most common; lag and lead times handle overlaps and gaps.
- Percentage complete — updated weekly as the minimum; daily on fast-moving trades.
- Milestones — zero-duration markers for planning conditions, inspections, practical completion, and handover.
- Baseline dates — the original planned dates, kept locked so you can measure slippage.
- Float (total float) — how many days a task can slip before it delays the project end date.
- Critical path — the longest sequence of dependent tasks from start to finish. Any delay to a critical-path activity delays the project.
SOMA Project Controls warns that hard date constraints can distort a tool’s reported critical path, making non-critical tasks appear critical and hiding the genuine longest-duration sequence. Keep hard constraints to a minimum and test the critical path by checking it runs continuously from project start to completion.
Pro Tip: As the programme grows past 50 tasks, use summary (roll-up) rows for each phase and apply filters by trade or phase. A chart with 200 individual bars is unreadable on a laptop screen. Summary rows let you present a clean overview to the client while the detail sits one click away.
Why use Gantt charts on construction projects?
The practical case for a construction Gantt chart is coordination, not paperwork. When every subcontractor can see their window, the trades before them, and the trades after them, the number of “I didn’t know they were still on site” clashes drops sharply.

Specific use cases where a Gantt chart pays for the time it takes to build:
Trade coordination. Plasterers cannot start until first-fix electrics and plumbing are signed off. Decorators cannot follow until plaster is dry. A live Gantt makes those windows visible to everyone, not just the project manager.
Material lead-time planning. Structural steel, timber frame, windows, and kitchen units all have significant lead times. Plotting procurement tasks on the Gantt against the installation date shows exactly when orders must be placed.
Inspection and permit scheduling. Planning conditions and permit processes create fixed milestones that cannot move. Building control inspections, warranty-provider stage inspections, and condition-discharge submissions all need to appear as milestones so the programme accounts for their lead times.
Client reporting. A one-page summary Gantt showing phase progress against baseline is far more useful to a client than a written report. It also makes variation negotiations cleaner: when a client requests a change, you can show immediately which tasks are affected and what the programme impact is.
Contractor mobilisation. Subbies need notice. A Gantt with confirmed start dates, shared in advance, gives groundworkers, frame erectors, and first-fix trades the lead time to resource the job properly.
The result, when the chart is kept live, is fewer RFIs caused by schedule clashes, better material availability, and a cleaner handover. On-time practical completion is the clearest measure of success.
How to build a construction Gantt chart: step-by-step
This workflow takes you from a blank sheet to a first-issue programme ready to send to subbies.
-
Define the scope and build your WBS. List every deliverable: substructure, superstructure, envelope, first fix, second fix, finishes, external works, commissioning, handover. Break each phase into individual tasks. A small new-build might have dozens of tasks; a larger scheme many more.
-
Assign a task ID and phase label to every row. Use a consistent format (e.g. 01-010 for substructure task 10). This makes cross-referencing with site diaries and RFIs straightforward.
-
Estimate durations in working days. Be realistic. Factor in curing times (concrete, screed, render), drying times (plaster), and typical weather buffers for external works. A practical construction schedule accounts for contingency from the outset rather than adding it as a lump at the end.
-
Set dependencies. Work through the task list and assign predecessors. Most construction dependencies are finish-to-start. Add lag where a curing or drying period is needed (e.g. 7-day lag after slab pour before frame erection).
-
Assign owners. Every task gets a named subcontractor or trade. If you do not know the sub yet, use the trade category (e.g. “M&E contractor”).
-
Add milestones. Planning condition discharge, building control inspections, warranty-provider stage checks, practical completion, and final account sign-off all need zero-duration milestone markers.
-
Add resources and procurement tasks. Long-lead items (structural steel, windows, kitchen units) need a procurement task that finishes before the installation task can start.
-
Baseline the programme. Save a locked copy of all planned start and finish dates before work begins. Label it Rev 0 with the issue date.
-
Issue to subbies with a revision number and date. Confirm they have received it and understand their windows.
-
Update weekly. Enter percentage complete against each active task. Compare actual progress to the baseline. Flag any critical-path slippage immediately.
Spreadsheet column spec (copy this into Excel or Google Sheets):
| Column | Field |
|---|---|
| A | Task ID |
| B | Phase |
| C | Trade / owner |
| D | Task description |
| E | Planned start |
| F | Planned finish |
| G | Duration (days) |
| H | Predecessors |
| I | % complete |
| J | Actual start |
| K | Actual finish |
| L | Contingency days |
| M | Notes / attachments |
Pro Tip: For UK sites, add a separate column for permit or inspection hold points. Flag any task that cannot start until a third-party sign-off is received. Planning conditions in England and Wales can take weeks to discharge; building control inspections need 24–48 hours’ notice as a minimum. Missing these from the programme is one of the most common causes of avoidable delay.
Worked example: starter Gantt for a small residential new-build
The sample job is a detached new-build on a single plot: two storeys, traditional masonry construction, 12–16 week programme from groundworks to practical completion. Planning permission is already granted; building regulations are approved.
The phases below show typical durations and key dependencies. Use them as a starting point and adjust for your site conditions, subcontractor availability, and specification.
| Phase | Key tasks | Duration (weeks) | Depends on |
|---|---|---|---|
| Substructure | Excavation, foundations, ground slab | 2–3 | Site clearance complete |
| Superstructure | Blockwork, beam and block floor, first-floor structure | 3–4 | Slab cured (7-day lag) |
| Envelope | Roof structure, tiling, windows and external doors | 2–3 | Superstructure complete |
| First fix | Electrics, plumbing, MVHR, structural openings | 2–3 | Building watertight |
| Second fix | Electrics, plumbing, joinery, kitchen, sanitaryware | 2–3 | Plaster dry (14-day lag) |
| Finishes | Decoration, floor coverings, external works | 2–3 | Second fix complete |
| Commissioning and handover | Snagging, sign-offs, O&M manuals, client walkthrough | 1 | Finishes complete |
Typical total programmes vary in length, generally including contingency for delays and resolution time. Add 1–2 weeks of float at the end for weather, supply delays, and snagging resolution.
To adapt this to a different job size, scale durations proportionally and add phases for any specialist works (basement, green roof, solar installation). For a refurbishment, add a strip-out phase at the start and a condition-survey milestone before pricing begins.
A downloadable starter template in Excel format, pre-populated with these columns and phases, is available from the BRCKS construction scheduling software page. Import it directly or use it as a base for your own programme.
How to integrate your Gantt with other site tools and workflows
A Gantt chart that sits in isolation from the rest of your site records becomes stale quickly. The goal is to make the programme the single reference point that everything else links back to.
Evidence and documents to attach per task:
- Substructure tasks — attach concrete pour records, cube test results, and building control inspection sign-offs.
- Frame and envelope tasks — attach structural engineer sign-offs, warranty-provider stage inspection certificates, and delivery notes for structural materials.
- First-fix milestones — attach RAMS for each trade before they mobilise. A RAMS document linked to the task start milestone gives you a clear audit trail.
- Inspection hold points — attach the inspection request, the inspector’s report, and any remedial action record.
- Variation tasks — when a variation changes the programme, log the variation instruction, the agreed revised dates, and the cost impact against the affected task.
Linking the site diary to the Gantt. A site diary app that files entries against a task reference gives you a timestamped record of what happened on each activity. When a dispute arises about why a task ran late, the diary entries are the evidence. Without that link, the diary and the programme are two separate documents that tell different stories.
BIM cross-references. On projects using a BIM model, reference the model revision number against the task that uses it. When the structural engineer issues a revised drawing, the task that depends on it gets updated with the new revision reference. This prevents trades working from superseded information.
Pro Tip: Agree a naming convention before the project starts: task IDs, drawing revision codes, RAMS document references, and photo file names should all follow the same format. A photo named “IMG_4521.jpg” is useless in a dispute. A photo named “01-040_slab-pour_2026-03-15.jpg” is evidence.
How do you choose the right Gantt tool for UK builders?
The right tool depends on the scale of the project, how many people need to access and update the schedule, and how much admin overhead you can absorb.
Spreadsheets work well for a single project manager running a small job with a handful of subbies. They break down when multiple people need to update the programme simultaneously, when evidence needs to be attached to tasks, or when the client expects live progress visibility.
Generic PM tools handle collaboration well but are not built for construction. They lack trade-sequencing logic, RAMS attachment workflows, and the site-diary integration that makes a programme traceable.
Construction-specific apps close those gaps. BRCKS is built in the UK for UK builders, with scheduling features that connect directly to site diaries, photo logs, and variation records. Subcontractors and clients get free access, so the programme reaches the whole team without extra seat costs. There is a subscription fee per seat for the management team to utilise the software.
Pro Tip: Before switching your whole business to a new tool, pilot it on one plot or one trade package. Run the spreadsheet and the new tool in parallel for four weeks. If the new tool saves time and the data is more reliable, roll it out. If it adds friction, adjust the workflow before committing.
Research on hybrid project management methodologies for UK transport projects suggests that the choice of project management methodology contributes materially to project success. The tool matters less than the discipline of using it consistently.
UK best practice: dynamic time modelling and hybrid scheduling
The CIOB’s Guide to Good Practice in the Management of Time in Major Projects recommends moving away from static baseline programmes toward a dynamic time model that integrates time and cost management throughout the project life cycle. The practical difference is significant: a static baseline is a document you compare against; a dynamic time model is a tool you interrogate.
For most UK residential and small commercial projects, full dynamic time modelling is not necessary. But the underlying principle applies at any scale: treat the programme as a living model, update it when conditions change, and use it to forecast the completion date rather than just record what has happened.
Hybrid scheduling approaches, mixing Lean techniques (Last Planner System, pull planning) with traditional Gantt-based programming, are gaining traction on larger UK projects. Pull planning sessions with subbies at the start of each phase produce more reliable short-term schedules than a top-down programme issued without consultation. The Gantt provides the overall framework; the pull plan fills in the detail for the next four to six weeks.
Practical steps to apply these ideas on a UK site:
- Review and reforecast the programme at least fortnightly, not just monthly.
- Hold a short programme review with the site team at the start of each phase, not just at the start of the project.
- Integrate cost tracking with schedule tracking: when a task slips, record the cost impact at the same time.
- Share the updated programme with the client at each review cycle. Clients who see progress without chasing are less likely to raise disputes.
For further reading on collaborative planning methods that complement Gantt scheduling, the BRCKS blog covers Lean and Agile integration in practical terms for UK builders.
Common pitfalls when using Gantt charts on site
Most Gantt charts fail for the same small set of reasons. Recognising them early saves the programme.
Overloaded charts. A chart with 300 individual tasks and no summary rows is unreadable. Nobody updates what they cannot read. Fix: add phase-level summary rows and use filters to show only the current phase or current trade.
Too many hard constraints. Hard date constraints (must start on, must finish on) override the scheduling logic and can make the tool report a misleading critical path. SOMA Project Controls advises reviewing all constraints and keeping hard constraints to a small fraction of total activities. Use soft constraints (start no earlier than, finish no later than) where possible.
Missing owners. A task with no named owner does not get updated. Before issuing the programme, every task must have a named subcontractor or trade. If the sub is not yet appointed, use the trade category and update it when the appointment is made.
Ignored baselines. Saving a baseline and then never looking at it is common. The baseline is only useful if you compare actual progress against it at each review. Set a standing agenda item for programme review at every site meeting.
Either the task is genuinely stalled and needs intervention, or nobody is updating the chart. Both problems need addressing. Assign one person per project the responsibility for updating percentage-complete data before each weekly review.
Pro Tip: Run a critical-path test at each programme review: check that the critical path runs continuously from project start to the completion milestone without jumping through hard constraints. If it does not, you have a constraint problem, not a schedule problem.
Starter templates and import notes
You do not need to build a Gantt chart from scratch. The column spec below is ready to copy into Excel or Google Sheets, or to use as the basis for a CSV import into scheduling software.
Spreadsheet columns to include before import:
- Task ID — unique alphanumeric reference (e.g. 01-010)
- Phase — substructure, superstructure, envelope, first fix, second fix, finishes, handover
- Trade / owner — named subcontractor or trade category
- Task description — plain-language description of the activity
- Planned start — date in DD/MM/YYYY format
- Planned finish — date in DD/MM/YYYY format
- Duration — working days (integer)
- Predecessors — task ID(s) of preceding tasks, comma-separated
- % complete — integer 0–100
- Actual start — leave blank until work begins
- Actual finish — leave blank until work is complete
- Contingency days — buffer days built into the task duration
- Notes / attachments — file reference or URL for linked evidence
Import tips. Most scheduling tools accept CSV. Check that date formats match the tool’s expected format before importing (DD/MM/YYYY is standard in the UK but some tools default to MM/DD/YYYY). Dependency syntax varies: some tools use task IDs, others use row numbers. Test with five rows before importing the full programme.
The BRCKS construction scheduling software page includes a starter template pre-populated with the column spec above and the residential-build phases from the worked example. Download it, adjust the durations for your project, and import or use it directly.
An experienced builder’s perspective on keeping programmes live
The biggest scheduling problem on most UK sites is not building the Gantt chart. It is keeping it current after the first two weeks.
The programme gets issued, subbies acknowledge it, and then the site moves faster or slower than planned. The groundworkers hit unexpected ground conditions. The window delivery slips three weeks. The client requests a variation that adds a dormer. Each event changes the programme, but the chart on the server still shows the original dates. By week four, the programme is a historical document, not a management tool.
The fix is simple but requires discipline. One person owns the programme update, every week, without exception. That person collects percentage-complete data from each trade on Friday afternoon, updates the chart, checks the critical path, and issues a revised programme to subbies and the client by Monday morning. The whole process takes 30–45 minutes on a small job when the data is already captured.

Evidence discipline matters just as much. When a task is marked complete, the evidence should be attached: a photo of the finished work, the building control sign-off, the delivery note for the materials. Without that, percentage-complete figures are opinions. With it, they are facts.
BRCKS was built to make this process less manual. The site diary app captures daily site records automatically, files photos against the right task, and logs variations with a full audit trail. The programme update becomes a matter of reviewing what the system has already captured rather than chasing subbies for updates by WhatsApp.
BRCKS keeps your construction programme live
Spreadsheets and generic tools get you started, but they do not close the loop between the schedule and what is actually happening on site. BRCKS does.
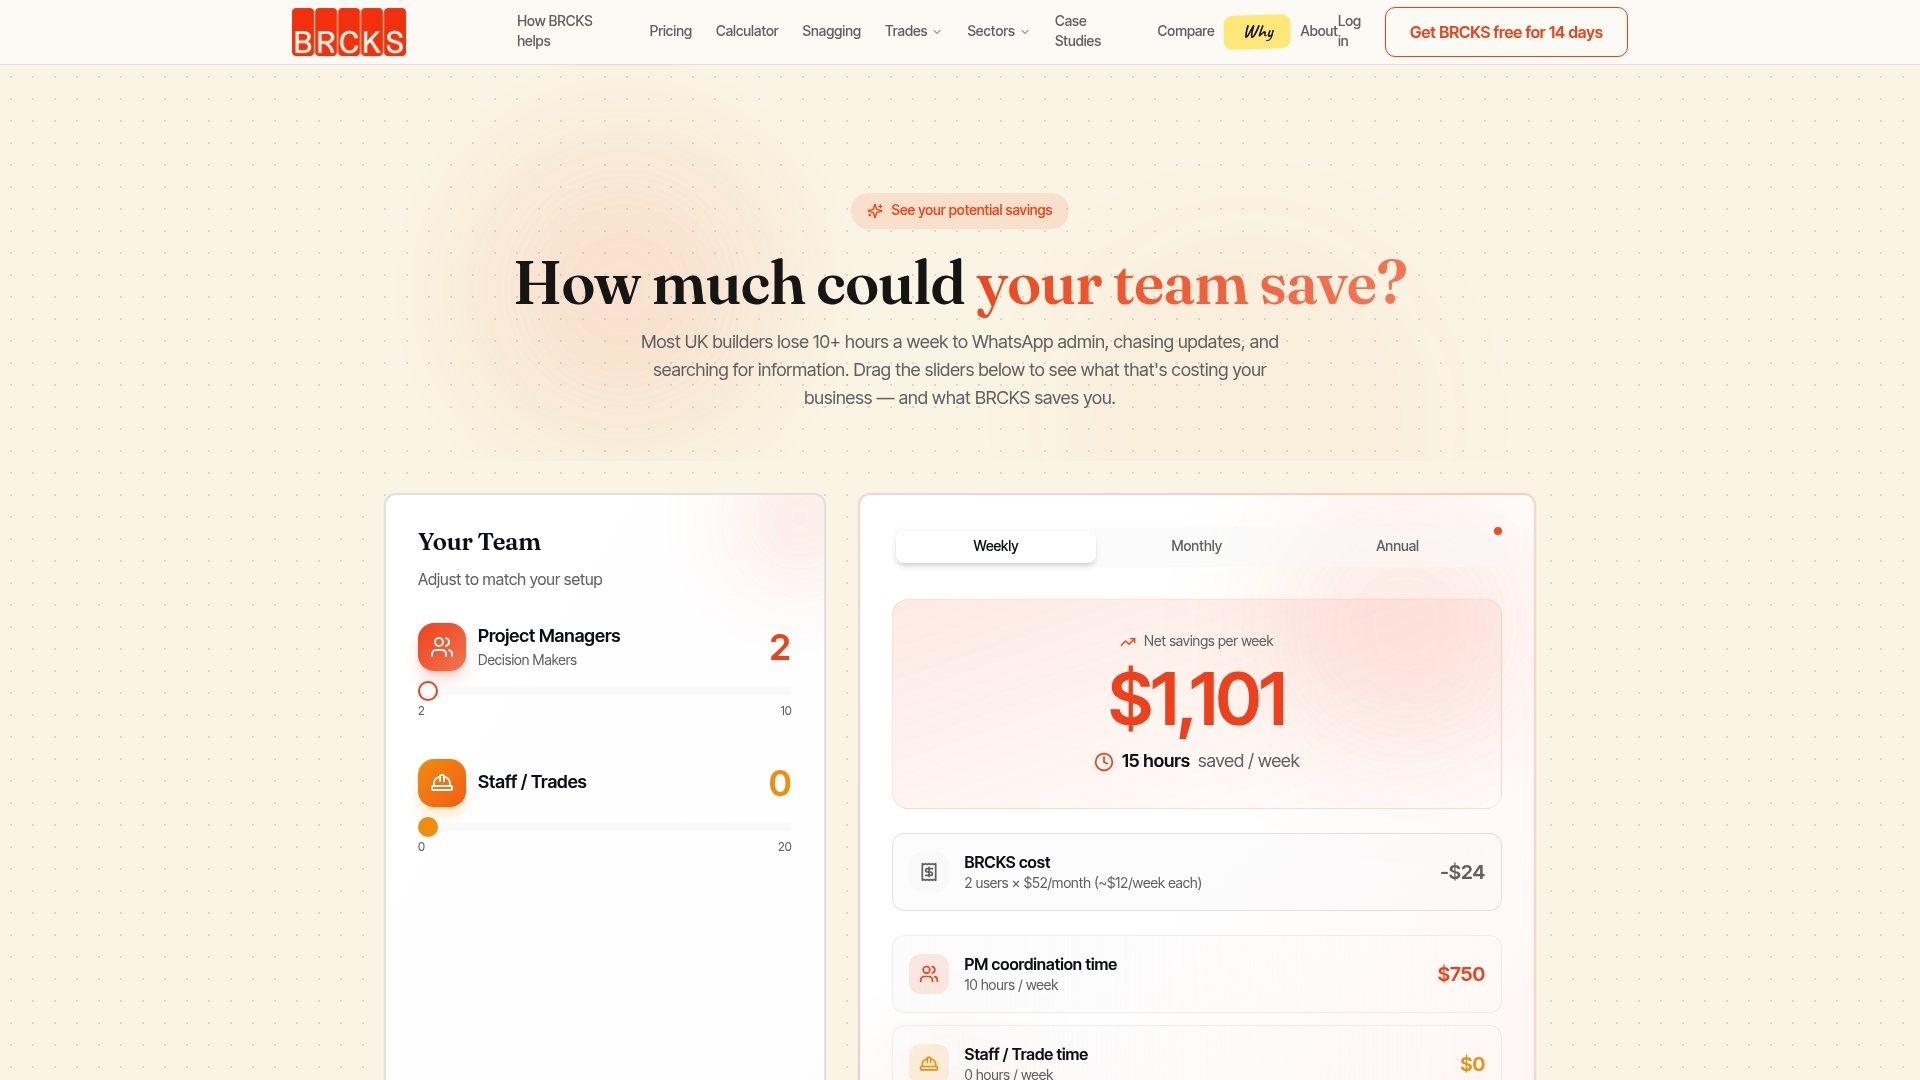
BRCKS is UK-built construction project management software that connects your programme directly to site diaries, photo logs, variation records, and RFI trails. When a subcontractor updates a task, the evidence is filed automatically. When a variation changes the programme, the impact is logged against the affected tasks with a full audit trail. Subbies and clients get free access, so the whole team works from the same schedule without extra seat costs.
At £40 per seat per month (billed annually), the paying seats are your core management team. Start with a 14-day free trial and pilot it on one project before committing. If a spreadsheet workflow suits your current scale, keep it. The important thing is that your programme stays live, whoever maintains it.
View BRCKS pricing and features or start your free trial today.
Sources
- Deploying the hybrid project management methodology framework in major transportation projects in the United Kingdom
- Gov
- Construction scheduling techniques | Oracle
- Critical Path Method: How UK Programmes Actually Use CPM · SOMA Project Controls
FAQ
What is a Gantt chart in construction?
A construction Gantt chart is a visual schedule that shows every project task as a horizontal bar across a timeline, with planned start and finish dates, durations, dependencies between trades, and key milestones such as inspections and handover.
What are the key elements of a construction Gantt chart?
The core fields are task name, owner (subcontractor or trade), planned start and finish, duration, predecessors, percentage complete, milestones, baseline dates, and total float. The critical path, showing the longest sequence of dependent tasks, is the most important output.
How do I build a construction Gantt chart?
Start with a work breakdown structure, estimate durations in working days, set finish-to-start dependencies between tasks, assign owners, add inspection and permit milestones, then baseline the programme before work starts. Update percentage complete weekly and compare against the baseline at every site meeting.
Can I use a spreadsheet for a construction Gantt chart?
Yes, for small projects a spreadsheet works well. Use the column spec in this guide (task ID, phase, trade, planned start/finish, duration, predecessors, percentage complete, contingency days). For larger projects or teams needing real-time collaboration, construction-specific scheduling software handles dependencies, critical-path calculation, and evidence linking automatically.
What is the difference between a timeline and a Gantt chart in construction?
A plain timeline lists dates; a Gantt chart shows task durations as bars and the dependencies between them. On a construction project, dependencies are critical: a Gantt chart makes it visible that plastering cannot start until first-fix trades are complete and inspected, whereas a date list cannot show that relationship.
Recommended
How BRCKS Can Help
Mastering Gantt charts is essential for keeping UK construction projects on track, but manual spreadsheets often struggle to keep pace with real-world site changes. BRCKS simplifies this process by integrating dynamic scheduling directly into your workflow, ensuring that every adjustment is reflected across your entire team in real time. By centralising your project data, BRCKS helps you move beyond static plans to achieve genuine operational efficiency. We invite you to explore how our platform can transform your project management by booking a demo or starting a free trial today. Learn more at BRCKS and explore our full feature set.