Construction company KPIs: a practical guide for managers
Discover how to move beyond vanity metrics by implementing operational construction KPIs that drive real-world decision-making and site efficiency.
By James Shorter ·
Construction company KPIs: a practical guide for managers

TL;DR:
- Construction KPIs measure critical project aspects and trigger management actions, not just data reporting. Starting with three to five SMART, operational indicators improves focus and decision-making, especially when supported by automated data collection. Benchmarking against national and sector data enhances target-setting and promotes continuous improvement.
A construction company KPI (key performance indicator) is a quantified measure that tells you whether a specific aspect of your project or business is on track. The six most useful KPIs to start tracking are: predictability of cost, schedule predictability, defect closure speed, safety incident rate, net cash flow, and labour productivity. These six cover the financial, programme, quality, safety, and operational dimensions that matter most to UK project teams, and each has a clear owner: commercial manager, programme manager, site manager, health and safety lead, finance director, and site foreman respectively.
Table of Contents
- What makes a construction KPI genuinely useful?
- The top construction KPIs, with formulas and owners
- How to choose the right KPIs and set targets that stick
- How to collect reliable KPI data on UK projects
- How BRCKS automates KPI data collection
- Where to benchmark and how to build dashboards that get used
- Common mistakes that make KPI programmes fail
- Key takeaways
- Why the field-to-board flow is where KPIs actually live
- Two hours a day back, every day
- Useful sources
- FAQ
What makes a construction KPI genuinely useful?
A KPI is not simply a number you report. It is a management signal that triggers a decision. The difference matters because construction teams are already drowning in data: timesheets, site diaries, RFI logs, variation orders, snagging sheets. A metric that sits in a spreadsheet and prompts no action is a vanity metric, not a KPI.
Constructing Excellence is direct on this point: KPIs become valuable when organisations move away from high-level vanity metrics towards operational measures that site teams can influence daily. That shift from boardroom scorecard to frontline tool is what separates companies that improve from those that just measure.
SMART properties applied to construction. A useful construction KPI is Specific (defect closure speed, not “quality”), Measurable (a formula exists and data is available), Achievable (realistic given your project type and team size), Relevant (tied to a business goal you actually care about), and Time-bound (reviewed weekly, monthly, or at a defined project stage). Applying SMART filters before you add a metric to your dashboard removes most of the noise.
Leading vs lagging indicators. Lagging indicators tell you what happened: cost overrun percentage, final defect count, accident frequency rate. Leading indicators tell you what is likely to happen: RFI response time, percentage of site diary entries completed on time, number of open snags older than seven days. Both matter, but leading indicators give you time to act. A rising RFI backlog is a warning sign; a completed project that ran 12% over budget is a post-mortem.
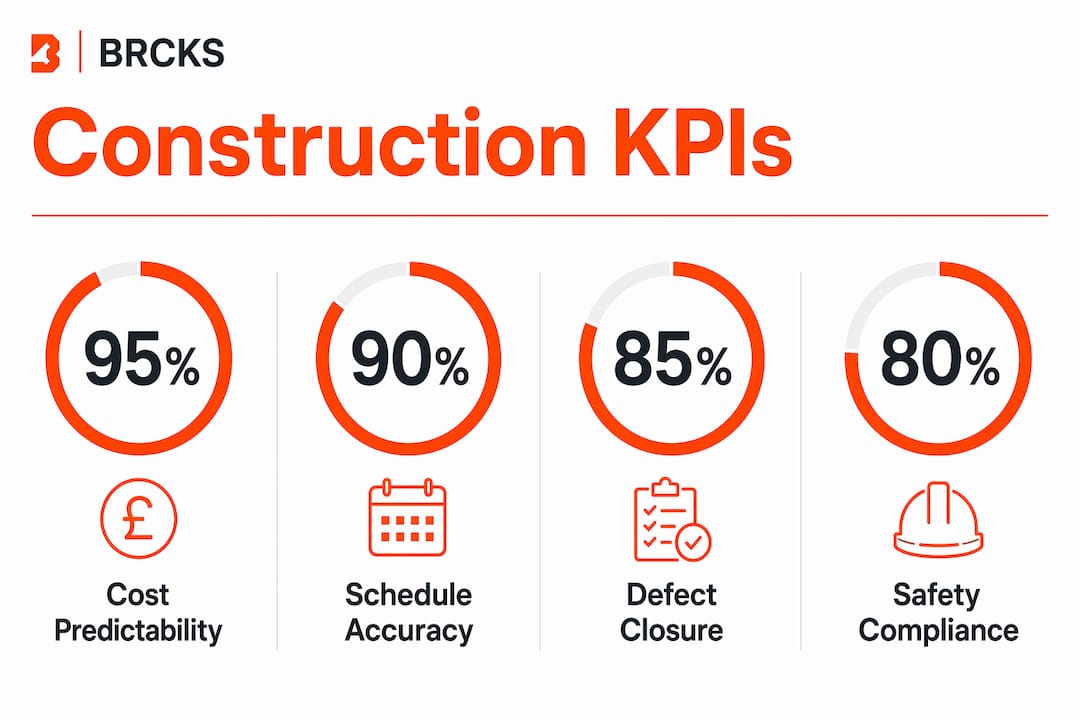
Pro Tip: Start with three to five KPIs. Constructing Excellence’s best-practice guidance recommends beginning with three to five measures and expanding only once your team has learned to react to the data. More metrics mean more admin and less focus.
The top construction KPIs, with formulas and owners
The table below groups the most widely used construction performance metrics by category. Each entry includes a measurement formula, the most practical data source on a typical UK project, a suggested owner, and a sample target to calibrate against.
| KPI | Formula | Data source | Owner | Sample target | Type |
|---|---|---|---|---|---|
| Predictability of cost | (Final cost ÷ Agreed contract cost) × 100 | Accounts / cost reports | Commercial manager | ≤105% (within 5% of contract sum) | Lagging |
| Schedule predictability | (Actual completion date ÷ Planned completion date) × 100 | Programme / site diary | Programme manager | ≤105% (within 5% of planned duration) | Lagging |
| Defect closure speed | Average days from snag raised to snag closed | Snag list / snagging app | Site manager | ≤7 days average | Leading |
| RFI turnaround time | Average days from RFI issued to response received | RFI log | Project manager | ≤5 working days | Leading |
| Safety incident rate | (Number of reportable incidents ÷ Hours worked) × 100,000 | Accident book / H&S records | H&S lead | Zero RIDDOR; trend ↓ | Lagging |
| Labour productivity | Earned value of work completed ÷ Labour hours expended | Timesheets / programme | Site foreman | Baseline + 5% improvement per project | Leading |
| Net cash flow | Monthly cash receipts minus monthly cash payments | Finance system | Finance director | Positive by month 3 | Lagging |
| Variation cost ratio | (Total approved variations ÷ Original contract sum) × 100 | Variation log | Commercial manager | ≤10% | Lagging |
| Client satisfaction score | Survey score (1–10 scale) at practical completion | Client survey | Account manager | ≥8/10 | Lagging |
| Waste to landfill | Tonnes of waste sent to landfill per £100k of project value | Waste transfer notes | Site manager | Year-on-year reduction | Lagging |
| Procurement lead time | Average days from order placed to materials on site | Procurement records | Buying manager | ≤14 days for standard materials | Leading |
Health and safety and environmental indicators consistently rank among the most used KPIs across UK construction sectors, which is why safety incident rate and waste to landfill both appear here rather than as optional extras.
Linking your variation log directly to the commercial ledger is a high-leverage habit. Timely variation records preserve entitlement evidence and reduce margin erosion at final account, particularly on NEC4 contracts where compensation events must be notified promptly.
How to choose the right KPIs and set targets that stick
Choosing KPIs without a process produces a random collection of metrics that nobody owns. The Plan → Analyse → Action → Review cycle, recommended by Constructing Excellence, gives you a repeatable framework.
-
Plan. Identify your top two or three business goals for the year (e.g. improve margin, reduce defects at handover, win repeat clients). Map one or two KPIs to each goal. If a metric does not connect to a goal, drop it.
-
Analyse. Collect a baseline. Run your chosen KPIs for four to six weeks before setting targets. Targets set without a baseline are guesses; targets set against your own recent data are commitments.
-
Action. Assign a named owner to each KPI. Without ownership, metrics drift. The owner is responsible for the data, the reporting, and the first response when a KPI moves outside its target range.
-
Review. Set a fixed review cadence: weekly for leading indicators (RFI turnaround, open snags), monthly for lagging indicators (cost predictability, client satisfaction). Review meetings should be short and decision-focused, not data-reading sessions.
Choosing your pilot set. For a first deployment, pick three to five KPIs that meet all of the following:
- Directly linked to a current business or project goal
- Data already exists or can be collected without new systems
- A named person is willing to own it
- The team can act on it within the reporting period
- It is a leading indicator, or pairs with one
Setting targets. The GOV.UK national KPI dataset is updated each June with data from the previous year and covers client satisfaction, predictability of time and cost, and energy and waste indicators across the UK construction industry. Use it to calibrate your targets against national benchmarks rather than internal gut feel. For cost and schedule predictability, the national dataset gives you a distribution: you can see where the median sits and set a stretch target at the upper quartile.
Pro Tip: Benchmarking against “best in class” is more motivating than benchmarking against your own average. Constructing Excellence defines best-in-class benchmarking as measuring against the top performers in your sector, not just the industry mean. Set one target at the median (achievable) and one at the upper quartile (stretch).
For a deeper walkthrough of the full implementation cycle, the construction KPIs guide for UK builders covers each stage with worked examples.
How to collect reliable KPI data on UK projects
The biggest barrier to consistent KPI tracking is not choosing the wrong metrics. It is data collection. Without reliable inputs, your KPIs are fiction.
Common data sources by category:
- Financial KPIs (cost predictability, cash flow, variation ratio): accounts software, cost reports, variation logs
- Schedule KPIs (schedule predictability, procurement lead time): programme files, site diaries, procurement records
- Quality/defect KPIs (defect closure speed): snag lists, snagging app records, inspection reports
- Safety KPIs (incident rate): accident book, RIDDOR records, toolbox talk logs
- Client KPIs (satisfaction score): post-completion surveys, client portal activity
- Productivity KPIs (labour productivity): timesheets, task tracking logs
Why automation changes the equation. Manual data collection from site diaries, snagging sheets, and RFI logs is time-consuming and inconsistent. When a site manager fills in a paper diary at the end of a long day, entries are compressed, timestamps are approximate, and photos are missing. Automation of routine records converts data collection from an administrative cost into a continuous improvement asset, with the return often showing up as reduced rework and faster final account settlement.
The most common data quality problems on UK projects are: incomplete or backdated site diary entries; RFIs logged late or not at all; inconsistent snagging practices across subcontractors; and variation orders raised verbally but not recorded in writing. Each of these creates a gap in your KPI data and, more seriously, a gap in your contractual record.

Practical fixes: standardise your site diary template and make it a daily non-negotiable; use a structured task tracking process to capture productivity data automatically; and require all RFIs to be logged in a central system before verbal responses are acted upon.
Pro Tip: Automate the highest-friction daily tasks first. Site diary completion and snag logging are the two records that most UK project teams find hardest to maintain consistently. Automating these two alone removes the majority of data gaps that undermine KPI reliability.
How BRCKS automates KPI data collection
BRCKS is built around the specific data collection problems that undermine KPI programmes on UK construction projects. Rather than adding a separate reporting layer, it captures KPI-relevant data as a by-product of the work your team is already doing.
- Automated site diaries capture daily progress, weather, resources on site, and photos in real time via WhatsApp, feeding schedule predictability and productivity KPIs without extra admin. The site diary app removes the end-of-day scramble entirely.
- Snag list software logs defects with photos, assigns them to a responsible party, and tracks closure dates automatically, giving you defect closure speed as a live metric rather than a manual count. See how the snag list software works in practice.
- RFI tracking records issue date, response date, and resolution, making RFI turnaround time a reportable KPI with no additional effort from the project manager.
- Structured variation logs tie every variation to a date, a description, and a cost, preserving the entitlement evidence that protects margin at final account.
- Client portals give clients visibility of progress without requiring the project manager to produce separate reports, which feeds client satisfaction data passively.
- WhatsApp integration means site teams log updates in the tool they already use, so adoption is immediate and data gaps are rare.
BRCKS saves users over two hours of manual effort daily, which on a typical project translates directly into more complete KPI data and fewer gaps in the audit trail. The hidden costs of manual project management are often invisible until a dispute arises at final account.
Where to benchmark and how to build dashboards that get used
Knowing your KPI values is only useful if you know whether they are good. UK construction managers have two primary benchmarking sources.

The GOV.UK national KPI dataset is the most authoritative national benchmark. Published each June, it covers client satisfaction, predictability of time and cost, and environmental indicators. It is free, publicly available, and directly comparable to the measures most UK contractors already track.
Constructing Excellence’s KPIzone provides sector-specific benchmarks and allows organisations to compare against peers in their project type and size band. For smaller builders and regional contractors, this is often more useful than the national dataset because the comparator pool is closer to your own project profile.
Sample dashboard by audience:
| Audience | KPIs to show | Cadence | Format |
|---|---|---|---|
| Site operative / foreman | Open snags, daily tasks completed, RFIs awaiting response | Daily | Mobile app / site board |
| Project manager | Defect closure speed, RFI turnaround, schedule variance, variation ratio | Weekly | Dashboard / weekly report |
| Commercial manager | Cost predictability, cash flow, variation cost ratio, procurement lead time | Weekly / monthly | Spreadsheet / finance system |
| Director / exec | Cost predictability, schedule predictability, client satisfaction, safety incident rate | Monthly | One-page summary |
The cadence matters as much as the content. A narrow dashboard of 3–5 KPIs mapped to specific owners and a clear reporting cadence is what separates organisations that improve from those that just collect data. Without it, measurement defaults to ad-hoc and inconsistent.
NEC4 Option X20 and contractual KPIs. On NEC4 contracts, Option X20 allows clients to specify KPIs at tender stage that can influence contractor behaviour and, in some cases, contractual outcomes. X20 KPIs must be carefully designed to be achievable and mutually beneficial; poorly designed KPIs in a contract setting can create perverse incentives. If you are working on a contract with X20 clauses, your internal measurement systems need to be accurate enough to withstand scrutiny, which is another reason why automated data collection matters.
For a comparison of reporting tools that can support your dashboard, the top reporting tools for UK construction sites guide covers the main options.
Common mistakes that make KPI programmes fail
Most KPI programmes in construction do not fail because the wrong metrics were chosen. They fail because of how the programme is run.
- KPI overload. Tracking fifteen metrics means nobody owns any of them. Successful firms prioritise a dashboard of 3–5 core KPIs. Adding more measures before you can act on the ones you have is a common and costly mistake.
- Vanity metrics. “Number of site visits” or “total photos uploaded” look like activity but measure nothing useful. If a metric cannot trigger a specific management decision, remove it.
- No named owner. A KPI without an owner is a number without a purpose. Every metric needs one person responsible for the data and one person responsible for the response.
- Poor data governance. Inconsistent snagging practices, backdated site diary entries, and verbal RFIs that never get logged all corrupt your KPI data. The metric looks stable while the underlying problem grows.
- Misaligned incentives. In contract settings, this is particularly acute. An X20 KPI that rewards speed at the expense of quality will produce exactly that trade-off. KPIs must be designed to encourage the behaviours you actually want.
- Stable metrics with no action. A KPI that never moves and never triggers a conversation is either measuring the wrong thing or not being measured honestly. If your defect closure speed has been exactly seven days for six months, check the data, not the performance.
- Repeated manual effort to produce numbers. If your project manager spends two hours every Friday pulling together the weekly KPI report, the programme will not survive the next busy period. Automate data capture before you scale the number of metrics.
Payment delays are one of the most common triggers for cash flow KPI deterioration. Understanding why construction payments get delayed can help you design procurement and financial KPIs that flag problems before they hit your cash position.
Key takeaways
A construction company KPI is only as useful as the action it triggers: start with three to five measures, assign a named owner to each, and automate data capture before you add more metrics.
| Point | Details |
|---|---|
| Start small, then expand | Begin with three to five KPIs; the Constructing Excellence best-practice guide recommends expanding only once your team reacts consistently to the data. |
| Use the Plan → Analyse → Action → Review cycle | Set a baseline before targets, assign owners, review leading indicators weekly and lagging indicators monthly. |
| Automate data capture first | Site diary completion and snag logging are the highest-friction tasks; automating these two removes most data gaps that undermine KPI reliability. |
| Benchmark against UK national data | The GOV.UK KPI dataset, updated each June, gives you a free national benchmark for cost predictability, schedule predictability, and client satisfaction. |
| BRCKS automates the collection | BRCKS captures site diary, snag closure, RFI turnaround, and variation data automatically, saving over two hours of manual effort daily and keeping KPI data audit-ready. |
Why the field-to-board flow is where KPIs actually live
The gap between a KPI on a dashboard and a decision on site is where most programmes break down. A project manager I know runs a weekly fifteen-minutestand-up with the site foreman, commercial manager, and subcontractor lead. The agenda is three numbers: open snags older than five days, RFIs awaiting response, and schedule variance against the two-week lookahead. That is it. No slides, no narrative, no retrospective. Just three numbers and the actions they require.
What makes that work is that the data arrives without anyone having to compile it. The site foreman logs progress through WhatsApp. Snags are raised and closed in the snagging app. RFIs are tracked centrally. By the time the stand-up starts, the numbers are already there. The meeting is about decisions, not data collection.
The cross-team flow matters too. When a site foreman raises a snag, the project manager sees it immediately. When the commercial manager spots a variation cost ratio creeping up, the conversation with the client happens that week, not at final account. KPIs only drive improvement when the information moves fast enough for the response to matter.
BRCKS features like automated site diaries, the snag list software, and the client portal are what make that flow possible without adding administrative burden to the people doing the work.
Two hours a day back, every day
Manual KPI data collection is the hidden tax on every construction project. Your site manager fills in a paper diary, your project manager re-enters it into a spreadsheet, your commercial manager chases the RFI log, and by Friday the numbers are already a week out of date. That is not a KPI programme. That is a reporting exercise that nobody trusts.
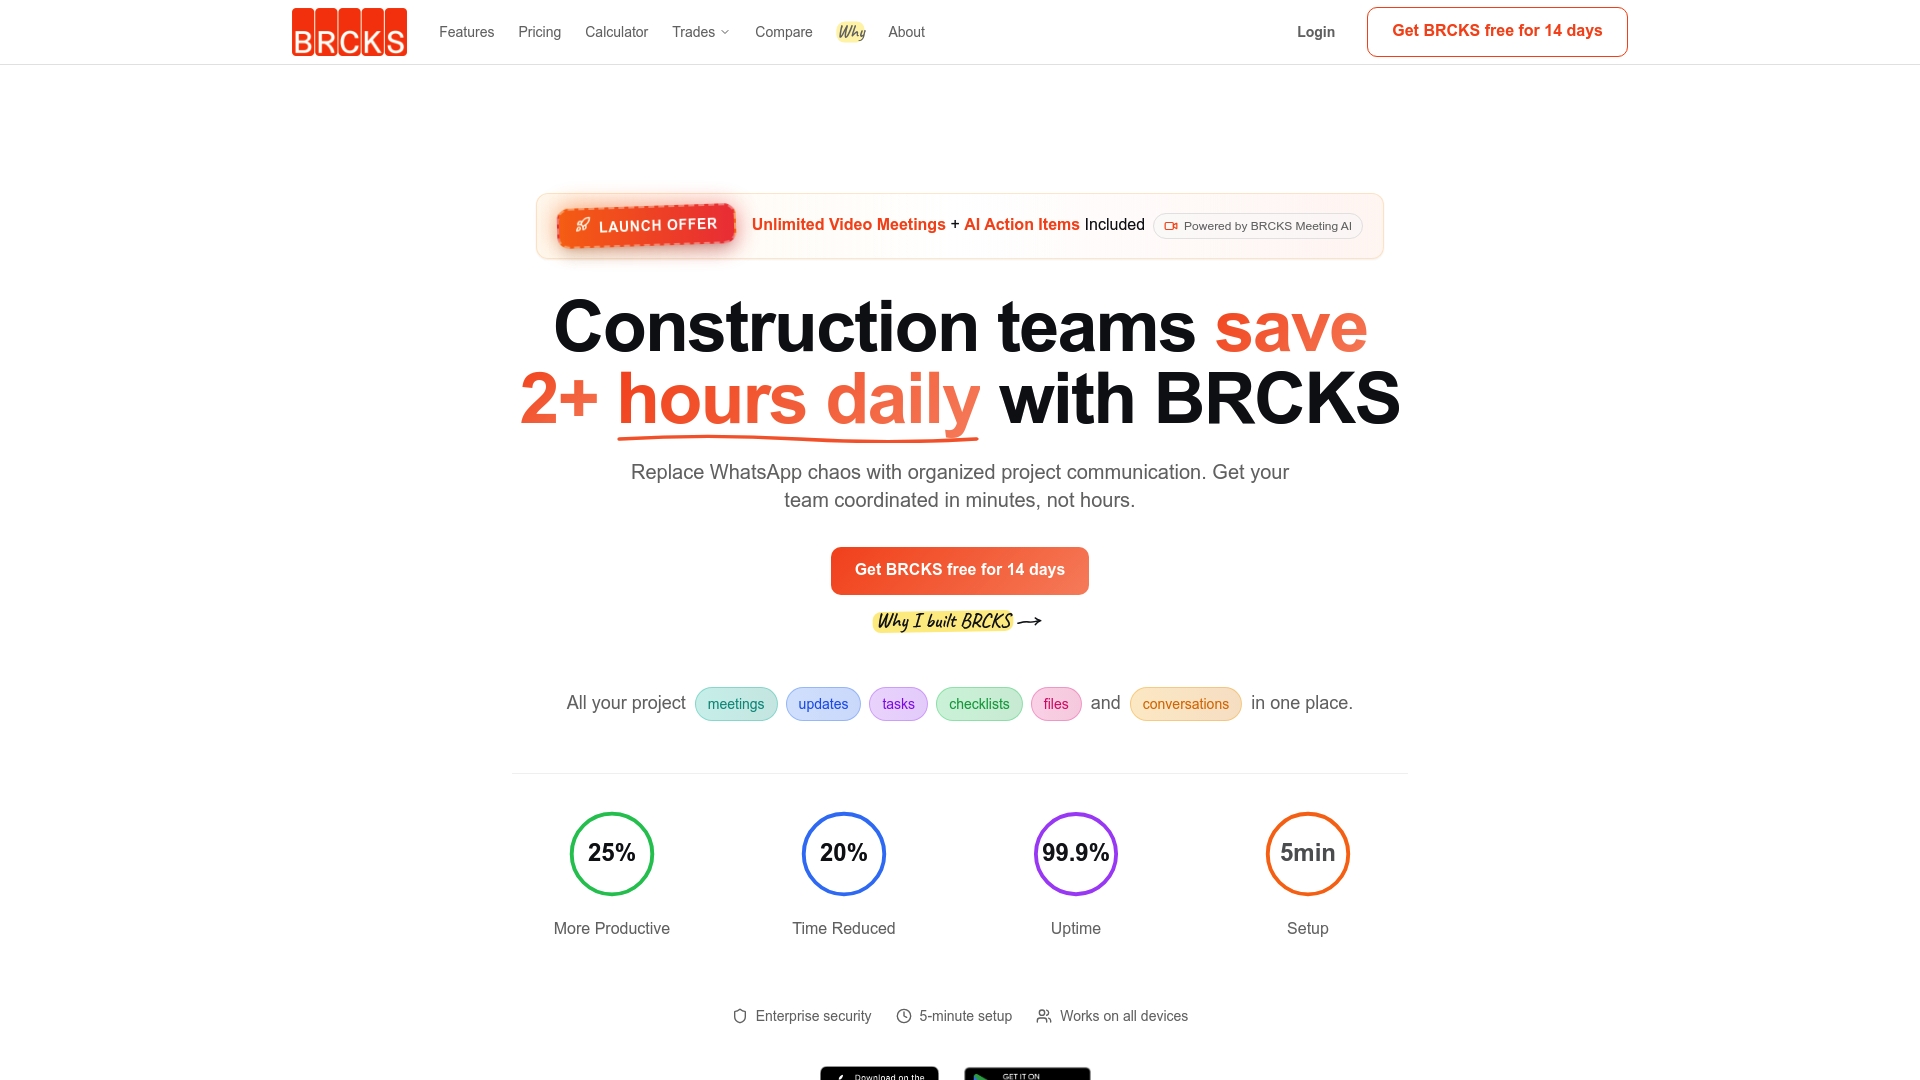
BRCKS removes that cycle entirely. The site diary app captures daily progress automatically via WhatsApp, so schedule and productivity KPIs update in real time. The snag list software tracks defect closure speed without a single spreadsheet. RFI turnaround, variation logs, and client satisfaction data are all captured as a by-product of normal project communication.
The result: over two hours of manual admin saved daily, KPI data that is audit-ready from day one, and a project team that spends its time acting on numbers rather than producing them.
Try BRCKS free for 14 days at brcks.io/builders and see which KPIs your current projects are actually hitting.
Useful sources
-
GOV.UK national KPI dataset — The UK government’s annual construction KPI publication, updated each June. Use it to benchmark cost predictability, schedule predictability, and client satisfaction against national figures. Directly supports the benchmarking and target-setting sections of this guide.
-
Constructing Excellence: KPIs and benchmarking — The industry body’s guidance on the Plan → Analyse → Action → Review cycle and the shift from vanity metrics to operational KPIs. The primary source for the implementation framework in this guide.
-
Constructing Excellence: KPI best practice guide (archive) — Detailed guidance on starting with four or five KPIs and expanding as your team learns to react to data. Supports the “start small” recommendation throughout this guide.
-
CECA NEC4 Bulletin No.41: X20 Key Performance Indicators (May 2024) — The Civil Engineering Contractors Association’s practical bulletin on NEC4 Option X20 KPI clauses. Essential reading if you are working on NEC4 contracts where KPIs have contractual consequences.
-
KPI Report for the Minister for Construction — The foundational government report that established the seven KPI groups (Time, Cost, Quality, Client Satisfaction, Client Changes, Business Performance, Health and Safety) still used across UK construction today.
FAQ
What are some KPIs used in construction?
The most widely used construction KPIs are predictability of cost, schedule predictability, defect closure speed, RFI turnaround time, safety incident rate, labour productivity, and client satisfaction score. The GOV.UK national KPI dataset publishes annual benchmarks for the most common measures across the UK industry.
What is an example of a KPI in a construction company?
Defect closure speed is a practical example: it measures the average number of days from a snag being raised to it being closed, using data from your snag list or snagging app. A target of seven days or fewer is a common starting point for residential and small commercial projects.
What are the 4 Ps of KPI?
The 4 Ps framework is not a standardised KPI methodology in UK construction. The recognised implementation cycle used by Constructing Excellence is Plan → Analyse → Action → Review, which covers goal-setting, baseline measurement, response, and governance.
How do NEC4 contracts use KPIs?
NEC4 Option X20 allows clients to specify KPIs at tender stage that can influence contractor behaviour and contractual outcomes. The CECA bulletin on X20 advises that KPIs must be achievable and agreed by both parties to avoid perverse incentives.
How many KPIs should a construction company track?
Start with three to five KPIs. Constructing Excellence’s best-practice guidance recommends beginning with three to five measures and expanding only once your team has learned to act consistently on the data. A focused dashboard is more effective than tracking dozens of metrics with no clear ownership.
Recommended
- BRCKS | Construction Project Communication Software
- Meeting Management Tips for UK Contractors | BRCKS
- Construction Project Leads UK: Guide to Winning More Work
- BRCKS | Construction Project Communication Software
How BRCKS Can Help
Tracking the right KPIs is essential for maintaining project profitability, but manual data entry often hinders real-time visibility. BRCKS simplifies this process by consolidating your site data into actionable insights, allowing managers to monitor performance without the administrative burden. By integrating these metrics directly into your workflow, you can make informed decisions that keep every build on track and within budget. We invite you to explore how BRCKS can transform your reporting and help your firm reach its next milestone. Learn more at BRCKS and explore our full feature set.